


 Ivana Lotoshynski, CFP®
People Wealth Matters
Financial Advisor
https://peoplewealthmatters.com
ilotoshynski@peoplewealthmatters.com
Monthly Market Insights | August 2024
U.S. Markets
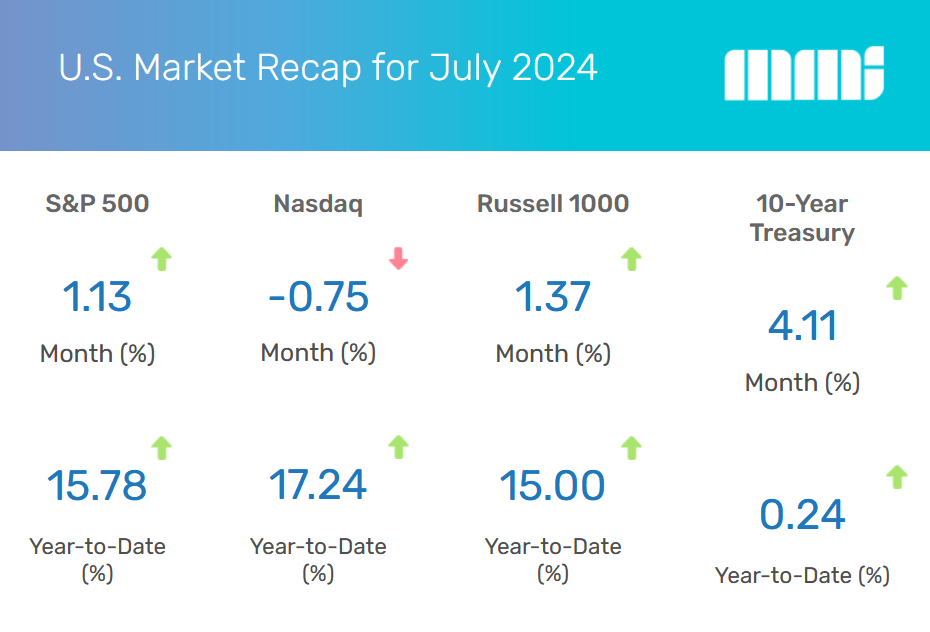
Stocks edged higher during a volatile month of trading as investors monitored economic reports about the Fed’s next move with short-term interest rates.
The Dow Jones Industrial Average led in July, picking up 4.41 percent. The Standard & Poor’s 500 Index added 1.13 percent while the Nasdaq Composite struggled, slipping 0.75 percent.1
“A mistake is valuable if you do four things with it: recognize it, admit it, learn from it, forget it.”
John Wooden, whose UCLA Bruins men’s basketball team won 10 NCAA national championships in a 12-year period, including a record seven in a row.
Fed One Step Closer?
Stocks opened the month strong, supported by a Consumer Price Index report that showed inflation dipped in June. The Personal Consumption Index, an inflation measure closely followed by the Fed, offered additional evidence that inflation was slowing. Some concluded this news may bring the Fed one step closer to adjusting short-term rates.2
Tech Under Pressure
The rally came under pressure mid-month, however, as investors turned away from technology issues to focus on small-cap names and the Dow Industrials. Investors anticipated that small caps and blue chips would be among the first stock market groups to benefit if the Fed cut short-term rates. The Russell 2000, a barometer for small-cap stocks, gained over 10 percent in July.3,4
Fed Chair Says ‘Rate Cut’ on the Table
As the month came to a close, stocks regained their momentum in the days leading up to July’s Fed meeting. When Fed Chair Jerome Powell indicated a September rate cut was “on the table,” stocks saw a broad-based rally on the last day of trading.5
Sector Scorecard
Ten of the eleven S&P 500 sectors finished the month in positive territory, led by Real Estate (+7.24 percent), Financials (+6.40 percent), Utilities (+6.82 percent), Industrials (+4.92 percent), Materials (+4.34 percent), and Healthcare (+2.66 percent).
Also posting solid gains were Energy (+2.25 percent), Consumer Staples (+1.66 percent), Consumer Discretionary (+2.79 percent) and Communication Services (+0.15 percent). The technology sector lost -3.29 percent for the month.6
Yahoo Finance, July 31, 2024. The market indexes discussed are unmanaged and generally considered representative of their respective markets. Individuals cannot directly invest in unmanaged indexes. Past performance does not guarantee future results. U.S. Treasury Notes are guaranteed by the federal government as to the timely payment of principal and interest. However, if you sell a Treasury Note prior to maturity, it may be worth more or less than the original price paid.
What Investors May Be Talking About in August
In the month ahead, expect attention to continue shifting to the election on November 5.
While much of the attention tends to focus on the presidency, it’s important to remember that 34 Senate races, all 435 House seats, and a host of other state and local initiatives will be on the ballot.
Here are three takeaways to consider:
- Expect the unexpected — Speeches, debates, and other comments from presidential candidates can lead to new information being released. Speculators can overreact to how a proposed policy idea may affect the economy and the financial markets.
- Anticipate market volatility — Historically, September and October have been the most volatile months for stock prices. Mix in some election uncertainty this year, and price swings may again mark September and October.7
- Remember your portfolio — There’s an old saying that goes, “You might care more about the election than your portfolio.” Remember that your goals, time horizon, and risk tolerance should guide investment decisions, not election cycles.
World Markets
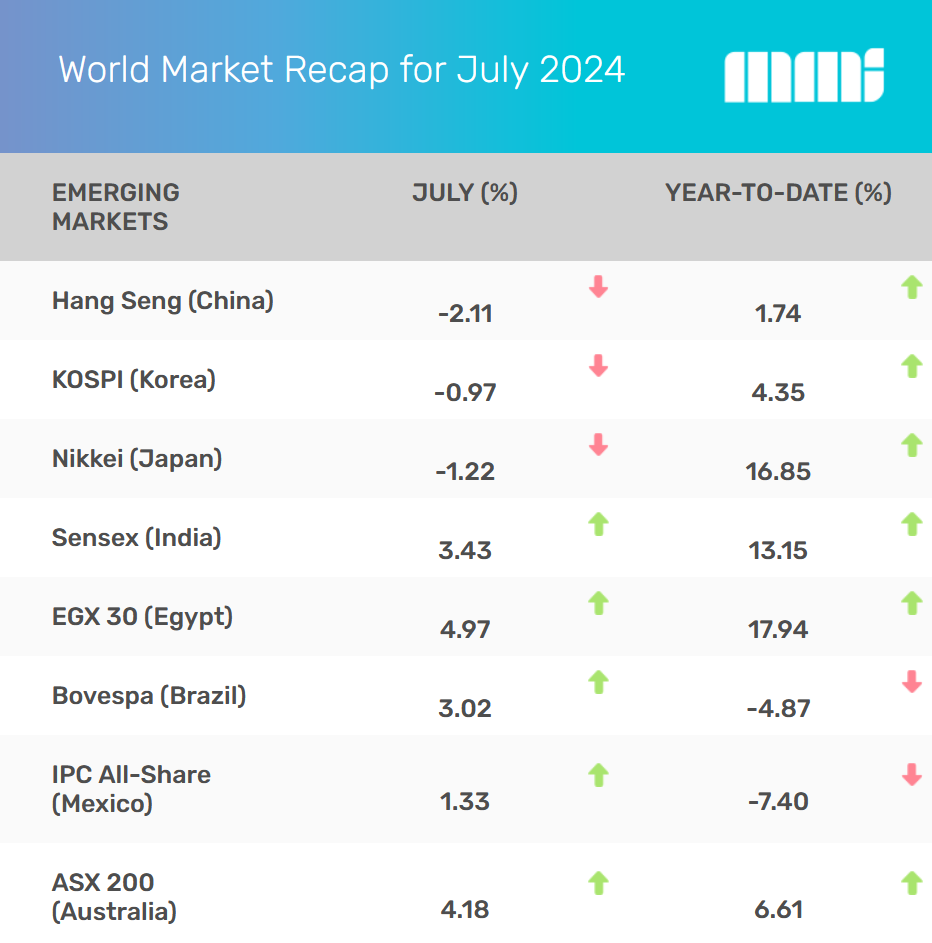
The MSCI-EAFE Index gained 2.89 percent in July as markets rallied globally.8
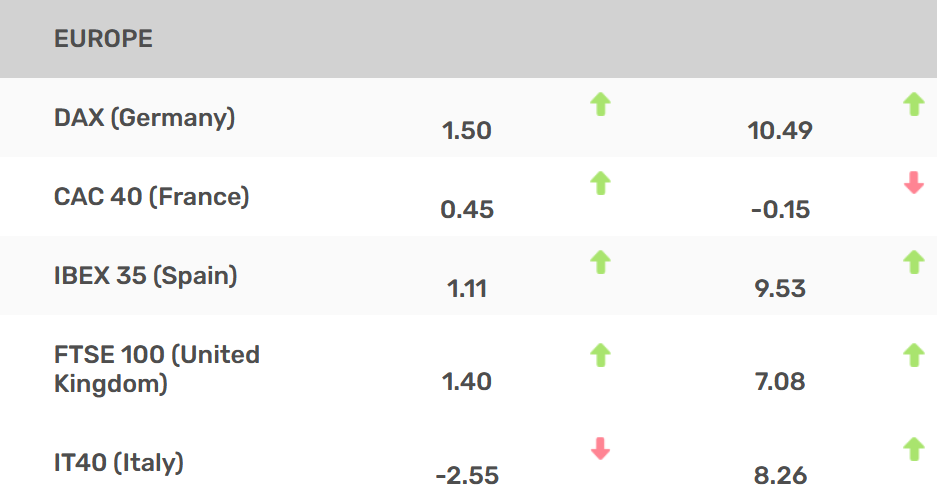
European stocks performed well, with the UK (+1.40 percent), Spain (+1.11 percent), France (+0.45 percent) and Germany (+1.50 percent) notching gains.9
Pacific Rim markets were mixed. India’s Sensex index rose 3.43 percent while Japan’s Nikkei lost 1.22 percent, and China’s Hang Seng index fell 2.11 percent.10
Yahoo Finance, July 31, 2024. The market indexes discussed are unmanaged and generally considered representative of their respective markets. Individuals cannot directly invest in unmanaged indexes. Past performance does not guarantee future results. International investments carry additional risks, which include differences in financial reporting standards, currency exchange rates, political risks unique to a specific country, foreign taxes and regulations, and the potential for illiquid markets. These factors may result in greater share price volatility.
Indicators
Gross Domestic Product (GDP)
The economy grew 2.8 percent on an annualized basis in the second quarter, exceeding the 2.1 percent expected by economists and doubling the first quarter’s 1.4 percent annualized pace.11
Employment
Employers added 206,000 jobs in June, compared with the 218,000 jobs created in May, which was slightly more than economists expected. The unemployment rate inched up to 4.1 percent, while average hourly earnings rose 3.9 percent year-over-year in June—the smallest wage gain since 2021.12
Retail Sales
Retail sales were unchanged in June, defying economic forecasts that called for a slowdown. Retail sales were supported by increases in a number of areas, including online sales, clothing, and building materials. Excluding autos and gas, retail sales rose 0.8 percent in June.13
Industrial Production
Industrial output rose 0.6 percent in June, higher than the 0.3 increase expected. All three industry groups—manufacturing, mining, and utilities—rose, with consumer goods (particularly autos and energy) contributing the most to the increase. June’s expansion followed a 0.9 rise in May.14
Housing
Housing starts rose 3.0 percent in June from an upwardly revised May pace, led by gains in multifamily starts–especially in the Northeast and Midwest. Year over year, total starts fell 4.4 percent as higher mortgage rates created headwinds for homebuilders.15
Sales of previously owned homes slumped 5.4 percent in June, marking a gradual shift from a seller’s market to a buyer’s market as inventory finally started to catch up with demand. The median sales price was up 4.1 percent year-over-year to $426,900.16
New home sales fell 0.6 percent in June, driven by decreases in the Northeast and Midwest. The median new home sales price was $417,300, and inventory was 9.3 months.17
Consumer Price Index (CPI)
Consumer prices declined 0.1 percent in June, better than economists expected. It was the third month in a row that inflation cooled and the first monthly decline since May 2020. Core inflation (CPI minus volatile food and energy prices) rose 0.1 percent in June.18
Durable Goods Orders
New orders of manufactured goods designed to last three years or longer declined 6.6 percent in June, compared with May’s 0.1 percent increase. The decline was led by transportation orders.19
The Fed
The Federal Reserve left interest rates unchanged at the 5.25-5.5 percent target range following its two-day meeting that ended on July 31.20
In its policy statement, the Federal Open Market Committee (FOMC) downgraded its level of concern around inflation, leading some to be more hopeful for a rate move at the September meeting.
At the press conference following the announcement, Fed Chair Powell added, “A reduction in the policy rate could be on the table as soon as the next meeting in September. We’re getting closer to the point at which it’ll be appropriate to reduce our policy rate, but we’re not quite at that point.”20.
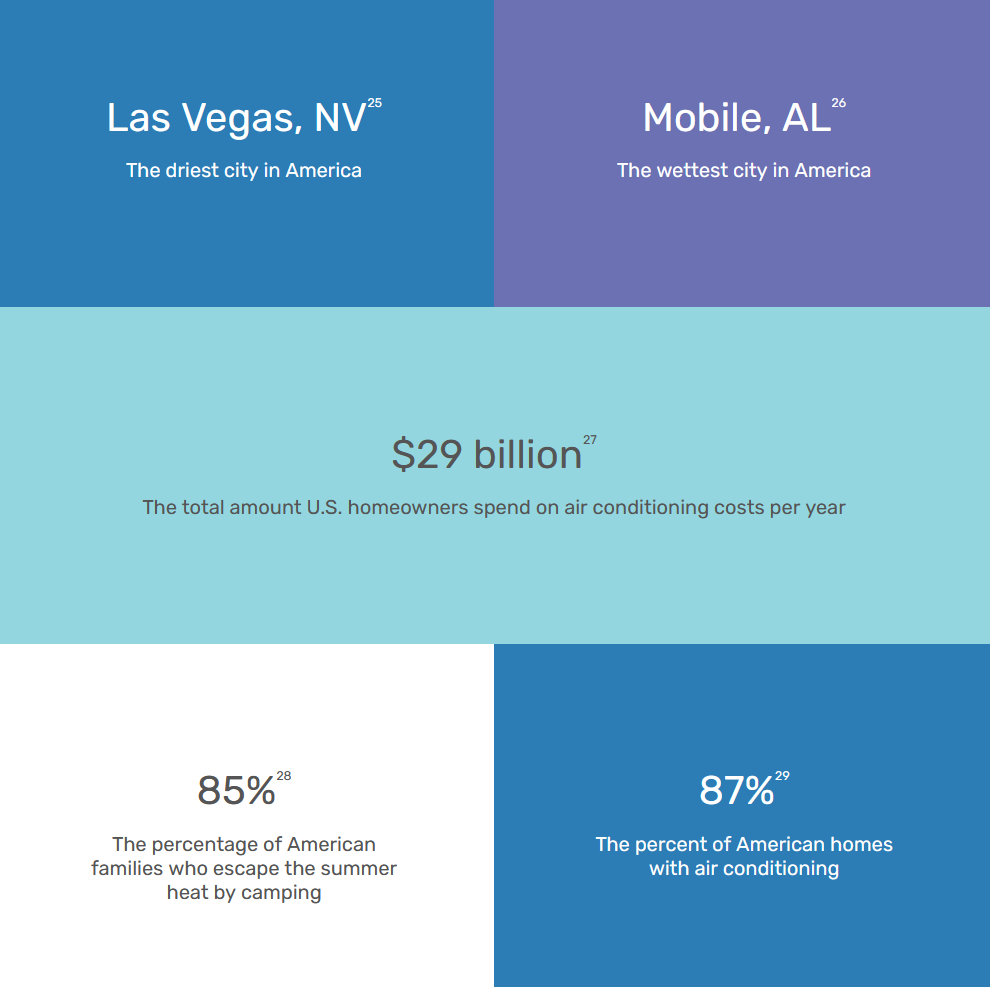
By the Numbers: Record Highs & Lows

The content is developed from sources believed to be providing accurate information. The information in this material is not intended as tax or legal advice. Please consult legal or tax professionals for specific information regarding your individual situation. This material was developed and produced by FMG Suite to provide information on a topic that may be of interest. FMG Suite, LLC, is not affiliated with the named representative, broker-dealer, or state- or SEC-registered investment advisory firm. The opinions expressed and material provided are for general information and should not be considered a solicitation for the purchase or sale of any security.
Investing involves risks, and investment decisions should be based on your own goals, time horizon and tolerance for risk. The return and principal value of investments will fluctuate as market conditions change. When sold, investments may be worth more or less than their original cost.
Any companies mentioned are for illustrative purposes only. It should not be considered a solicitation for the purchase or sale of the securities. Any investment should be consistent with your objectives, timeframe, and risk tolerance.
The forecasts or forward-looking statements are based on assumptions, subject to revision without notice, and may not materialize.
The market indexes discussed are unmanaged and generally considered representative of their respective markets. Individuals cannot directly invest in unmanaged indexes. Past performance does not guarantee future results.
The Dow Jones Industrial Average is an unmanaged index that is generally considered representative of large-capitalization companies on the U.S. stock market. The S&P 500 Composite Index is an unmanaged group of securities considered to be representative of the stock market in general. The Nasdaq Composite is an index of the common stocks and similar securities listed on the Nasdaq stock market and considered a broad indicator of the performance of stocks of technology and growth companies. The Russell 1000 Index is an index that measures the performance of the highest-ranking 1,000 stocks in the Russell 3000 Index, which is comprised of 3,000 of the largest U.S. stocks. The MSCI EAFE Index was created by Morgan Stanley Capital International (MSCI) and serves as a benchmark for the performance in major international equity markets, as represented by 21 major MSCI indexes from Europe, Australia, and Southeast Asia. Index performance is not indicative of the past performance of a particular investment. Past performance does not guarantee future results. Individuals cannot invest directly in an index. The return and principal value of stock prices will fluctuate as market conditions change. And shares, when sold, may be worth more or less than their original cost.
International investments carry additional risks, which include differences in financial reporting standards, currency exchange rates, political risks unique to a specific country, foreign taxes and regulations, and the potential for illiquid markets. These factors may result in greater share price volatility.
The Hang Seng Index is a benchmark index for the blue-chip stocks traded on the Hong Kong Stock Exchange. The KOSPI is an index of all stocks traded on the Korean Stock Exchange. The Nikkei 225 is a stock market index for the Tokyo Stock Exchange. The SENSEX is a stock market index of 30 companies listed on the Bombay Stock Exchange. The Jakarta Composite Index is an index of all stocks that are traded on the Indonesia Stock Exchange. The Bovespa Index tracks 50 stocks traded on the Sao Paulo Stock, Mercantile, & Futures Exchange. The IPC Index measures the companies listed on the Mexican Stock Exchange. The MERVAL tracks the performance of large companies based in Argentina. The ASX 200 Index is an index of stocks listed on the Australian Securities Exchange. The DAX is a market index consisting of the 30 German companies trading on the Frankfurt Stock Exchange. The CAC 40 is a benchmark for the 40 most significant companies on the French Stock Market Exchange. The Dow Jones Russia Index measures the performance of leading Russian Global Depositary Receipts (GDRs) that trade on the London Stock Exchange. The FTSE 100 Index is an index of the 100 companies with the highest market capitalization listed on the London Stock Exchange.
Please consult your financial professional for additional information.
Copyright 2024 FMG Suite.
1. WSJ.com, July 31, 2024
2. CNBC.com, July 11, 2024
3. CNBC.com, July 17, 2024
4. WSJ.com, July 31, 2024
5. CNBC.com, July 31, 2024
6. SectorSPDRs.com, July 31, 2024
7. Nasdaq.com, October 3, 2023
8. MSCI, July 31, 2024
9. MSCI, July 31, 2024
10. MSCI, July 31, 2024
11. WSJ.com, July 25, 2024
12. WSJ.com, July 5, 2024
13. APnews.com, July 16, 2024
14. KPMG.com, July 17, 2024
15. KPMG.com, July 17, 2024
16. CNBC.com, July 23, 2024
17. BankingJournal.ABA.com, July 24, 2024
18 APnews.com, July 11, 2024
19. BankingJournal.ABA.com, July 25, 2024
20. WSJ.com, July 31, 2024
21. NPS.gov, 2024
22.Yahoo.com, 2024
23. NPS.gov, 2024
24. NPS.gov, 2024
25. NPS.gov, 2024
26. NPS.gov, 2024
27. EIA.gov, 2024
28. EIA.gov, 2024
29. EIA.gov. 2024